So did you figure out who I am?
About Me Education Skills Hobbies Experience Projects Certifications Contact Me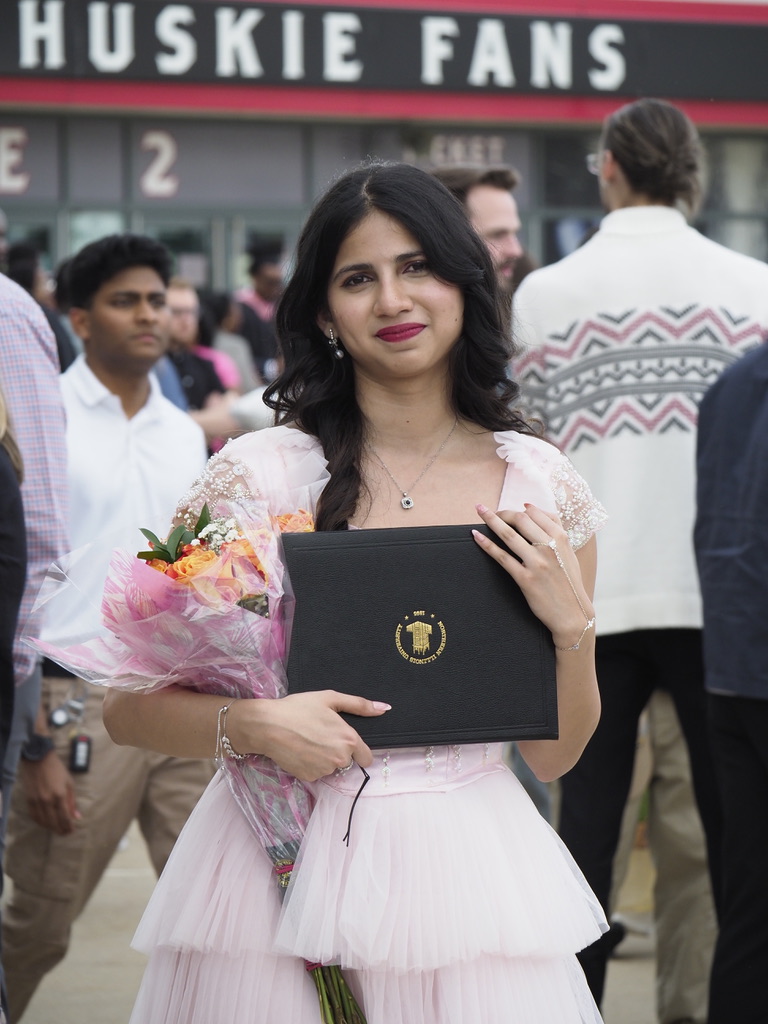
Hi, I'm
Sharwani Dudam
Data & Business Analyst
A data enthusiast and recent M.S. Information Systems graduate who loves turning messy problems into clean, actionable insights. I've spent time in business consulting and research, so I know how to bridge the gap between numbers and real-world decisions.
Outside of work, I'm all about fashion, finding the perfect outfit for every occasion, and building the ultimate skincare routine. I'm currently on the hunt for my next opportunity in data science or analytics — and always up for a great conversation.
Education
Operations Management & Information Systems
Northern Illinois University
Computer Science
BV Raju Institute of Technology
Skills
Languages
Visualization
ML & AI
Statistical Tools
Tools & Platforms
Version Control & Methods
Experience
Business Strategy Consultant
📍 Lombard, IL- Collaborated within a 6-member cross-functional team across 3 weekly strategy and client review meetings over a 5-month consulting engagement.
- Delivered 2 formal presentations to 10 client managers and senior leadership, communicating analytical findings and strategic recommendations.
- Evaluated 12 AI tools across employee retention, sales, customer service, and hiring — recommending 6 tools with implementation strategies for TQL leadership.
- Developed a Gen Z-targeted social media strategy across Instagram, YouTube, and X, providing a data-driven content framework to expand TQL's brand presence.
- Enhanced TQL's Freight for Disaster program by proposing domestic improvements and developing an international expansion framework.
- Utilized Power BI, PowerPoint, Excel, and Word to conduct research, build visualizations, and deliver professional business deliverables.
Research Assistant
📍 DeKalb, IL- Conducted 100+ live telephone interviews with U.S. residents as part of the Illinois Behavioral Risk Factor Surveillance System (IL-BRFSS), the nation's largest continuously conducted health survey.
- Collaborated within a 50+ member research team, dedicating 20–35 hours per week across academic and summer terms.
- Collected, entered, and cleaned behavioral health survey data ensuring accuracy and consistency across records used by Illinois state and county health departments.
- Built reports and dashboards using Power BI and Excel to visualize survey findings, supporting research supervisors in tracking behavioral health trends across Illinois communities.
Projects
Glaucoma Detection Using Deep Learning
- Built an automated glaucoma detection system with a 5-member team using ResNet-50 transfer learning across 4 retinal image datasets (G1020, RIM-ONE, ORIGA, DRISHTI-GS).
- Implemented full preprocessing pipeline including grayscale conversion, data augmentation, and model fine-tuning.
- Presented model findings and deep learning methodology to an academic audience, communicating complex medical imaging results clearly.
Emotion Detection in Text Using NLP
- Built an NLP pipeline with a 4-member team to classify multiple emotions (happiness, sadness, anger, fear, surprise) from text sentences paired with emojis.
- Trained and evaluated Naive Bayes, Logistic Regression, and Random Forest models on a large labeled dataset.
- Presented findings and model methodology to the Dean and faculty, effectively communicating complex NLP techniques to a senior academic audience.
Healthcare Cost Disparities Analysis — Immigrants vs. U.S.-Born Adults
- Built an automated Python pipeline to clean and process 2023 federal MEPS survey data, transforming 18,919 raw records into an analysis-ready dataset of 14,846 adults with survey-weighted, population-representative estimates.
- Wrote 9 SQL queries using CTEs and window functions to segment healthcare spending by nativity, insurance, and demographics, uncovering that foreign-born adults spend 40% less annually ($5,688 vs. $9,415) yet are 3× as likely to be uninsured.
- Delivered an interactive Tableau dashboard and stakeholder brief translating findings into targeted enrollment and preventive-care recommendations to reduce downstream acute-care costs.
Multi-System Data Reconciliation Pipeline
- Built an end-to-end pipeline that unifies three conflicting enterprise data sources — an ERP export, a CRM export, and a manually-maintained spreadsheet — into a single trusted dataset of 595 customers and 1,424 orders.
- Matches records by exact email first, then falls back to fuzzy name matching (rapidfuzz) for records with no shared identifier, applying documented source-precedence rules to resolve conflicts. Anything the pipeline isn't confident about is routed to a human review queue instead of guessed.
- Validated matching logic against hidden ground truth, achieving 98.5–100% precision and recall on the hardest fuzzy-matching cases. Caught a bug in the scoring methodology, traced and fixed it, then stress-tested the full pipeline against 5 additional randomly generated datasets to confirm results generalize.
- Includes a live self-contained dashboard and a human-review tool for exception handling. Full code and documentation on GitHub.
Interactive Arcade Game
- Developed a fully functional arcade game as part of a 4-member team, implementing core gameplay mechanics with a real-time dynamic scoring system.
- Built complete game features including multi-level progression, animations, background design, sound effects, and music.
- Presented the project to a women in technology organization, showcasing the game as a first independent software development achievement.
Certifications
Automate Boring Stuff with Python
UdemyLearning Machine Learning (Calculus)
LinkedIn LearningData Analytics Job Simulation
Deloitte Australia · ForageQuantitative Research Virtual Experience
JPMorgan Chase · ForageGoogle AI Essentials
GoogleClaude 101
Anthropic EducationAI Fluency for Students
Anthropic EducationActuarial Analyst Job Simulation
AIG · ForageWorking as a Software Engineer at a Start Up Job Simulation
Y Combinator · ForageHobbies
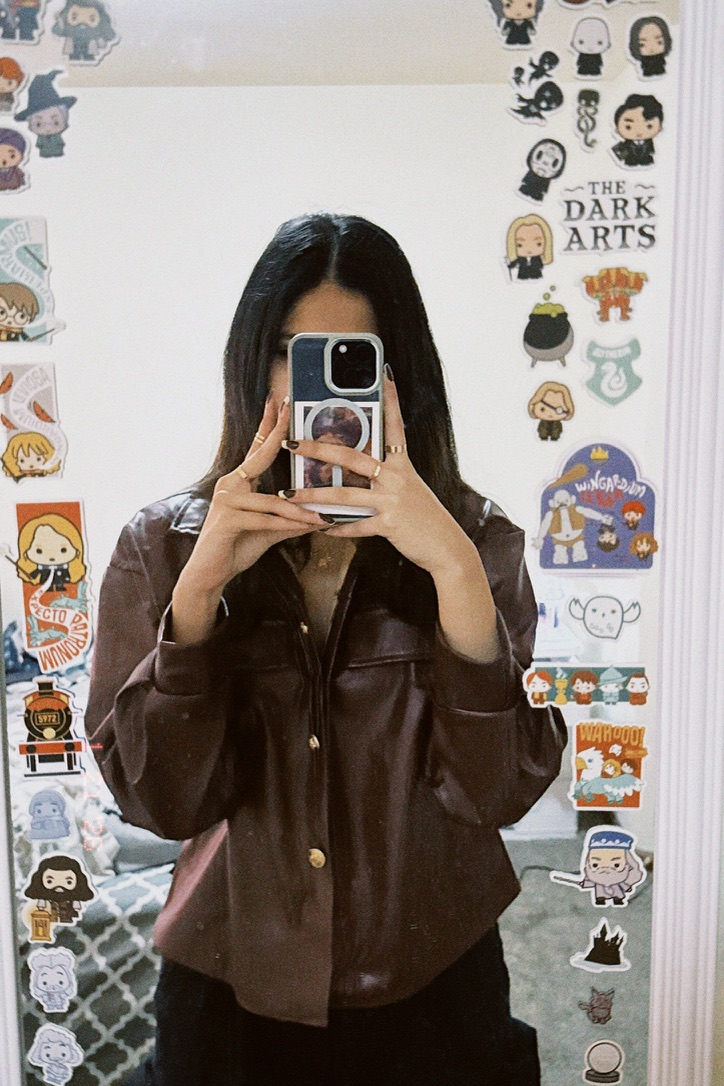
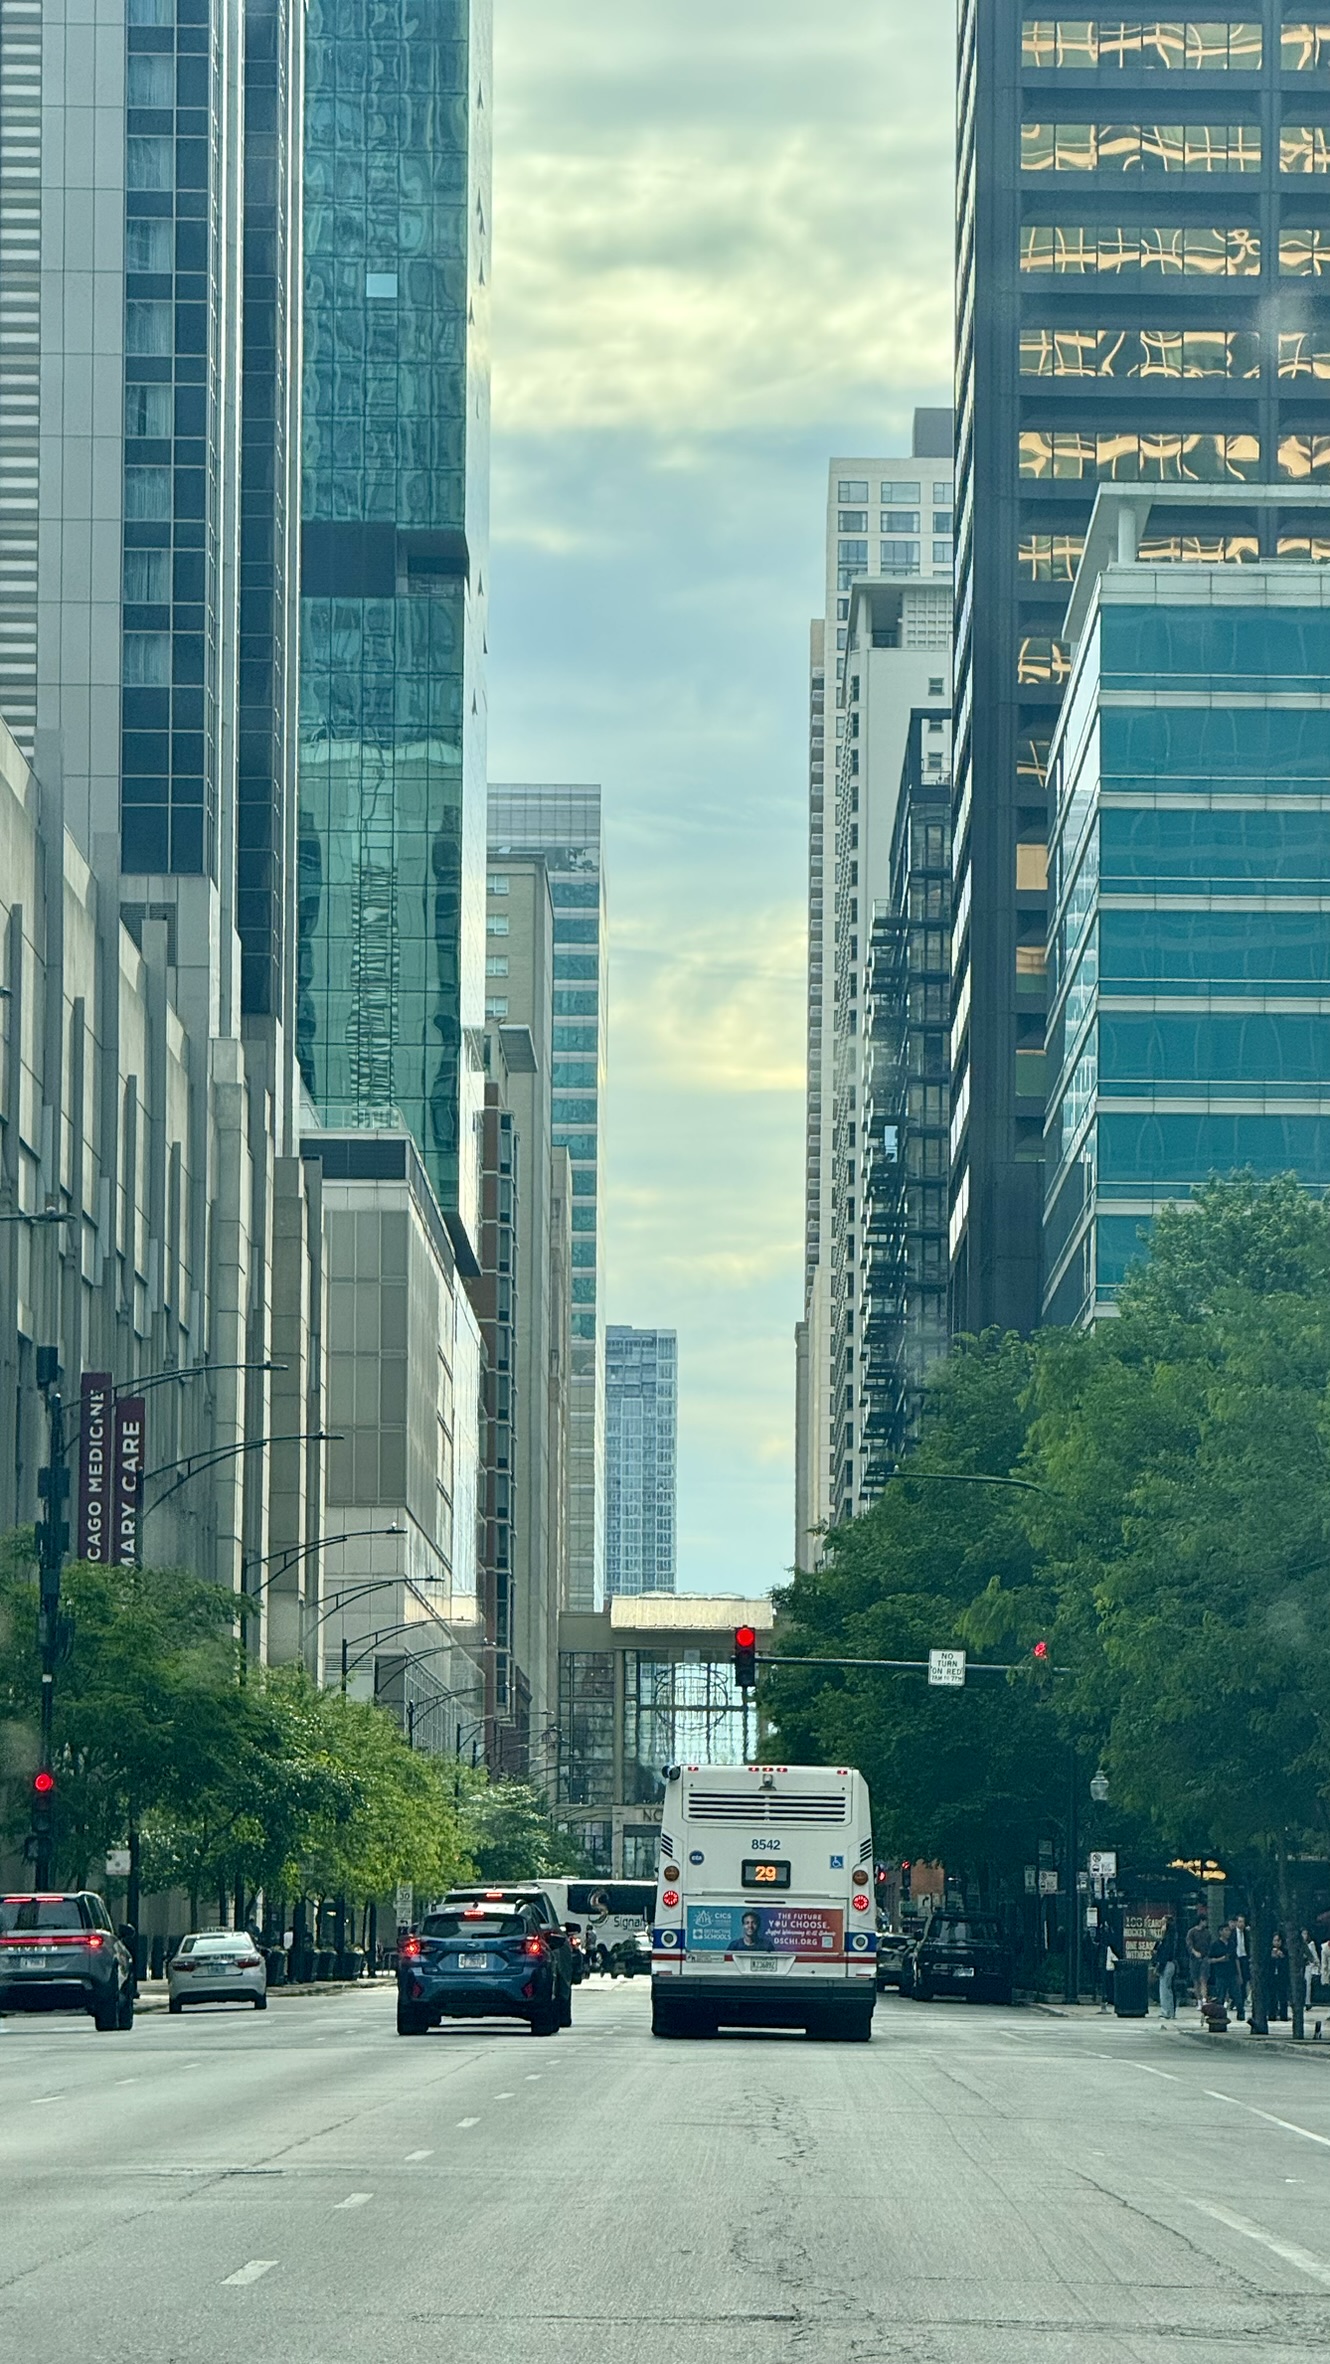
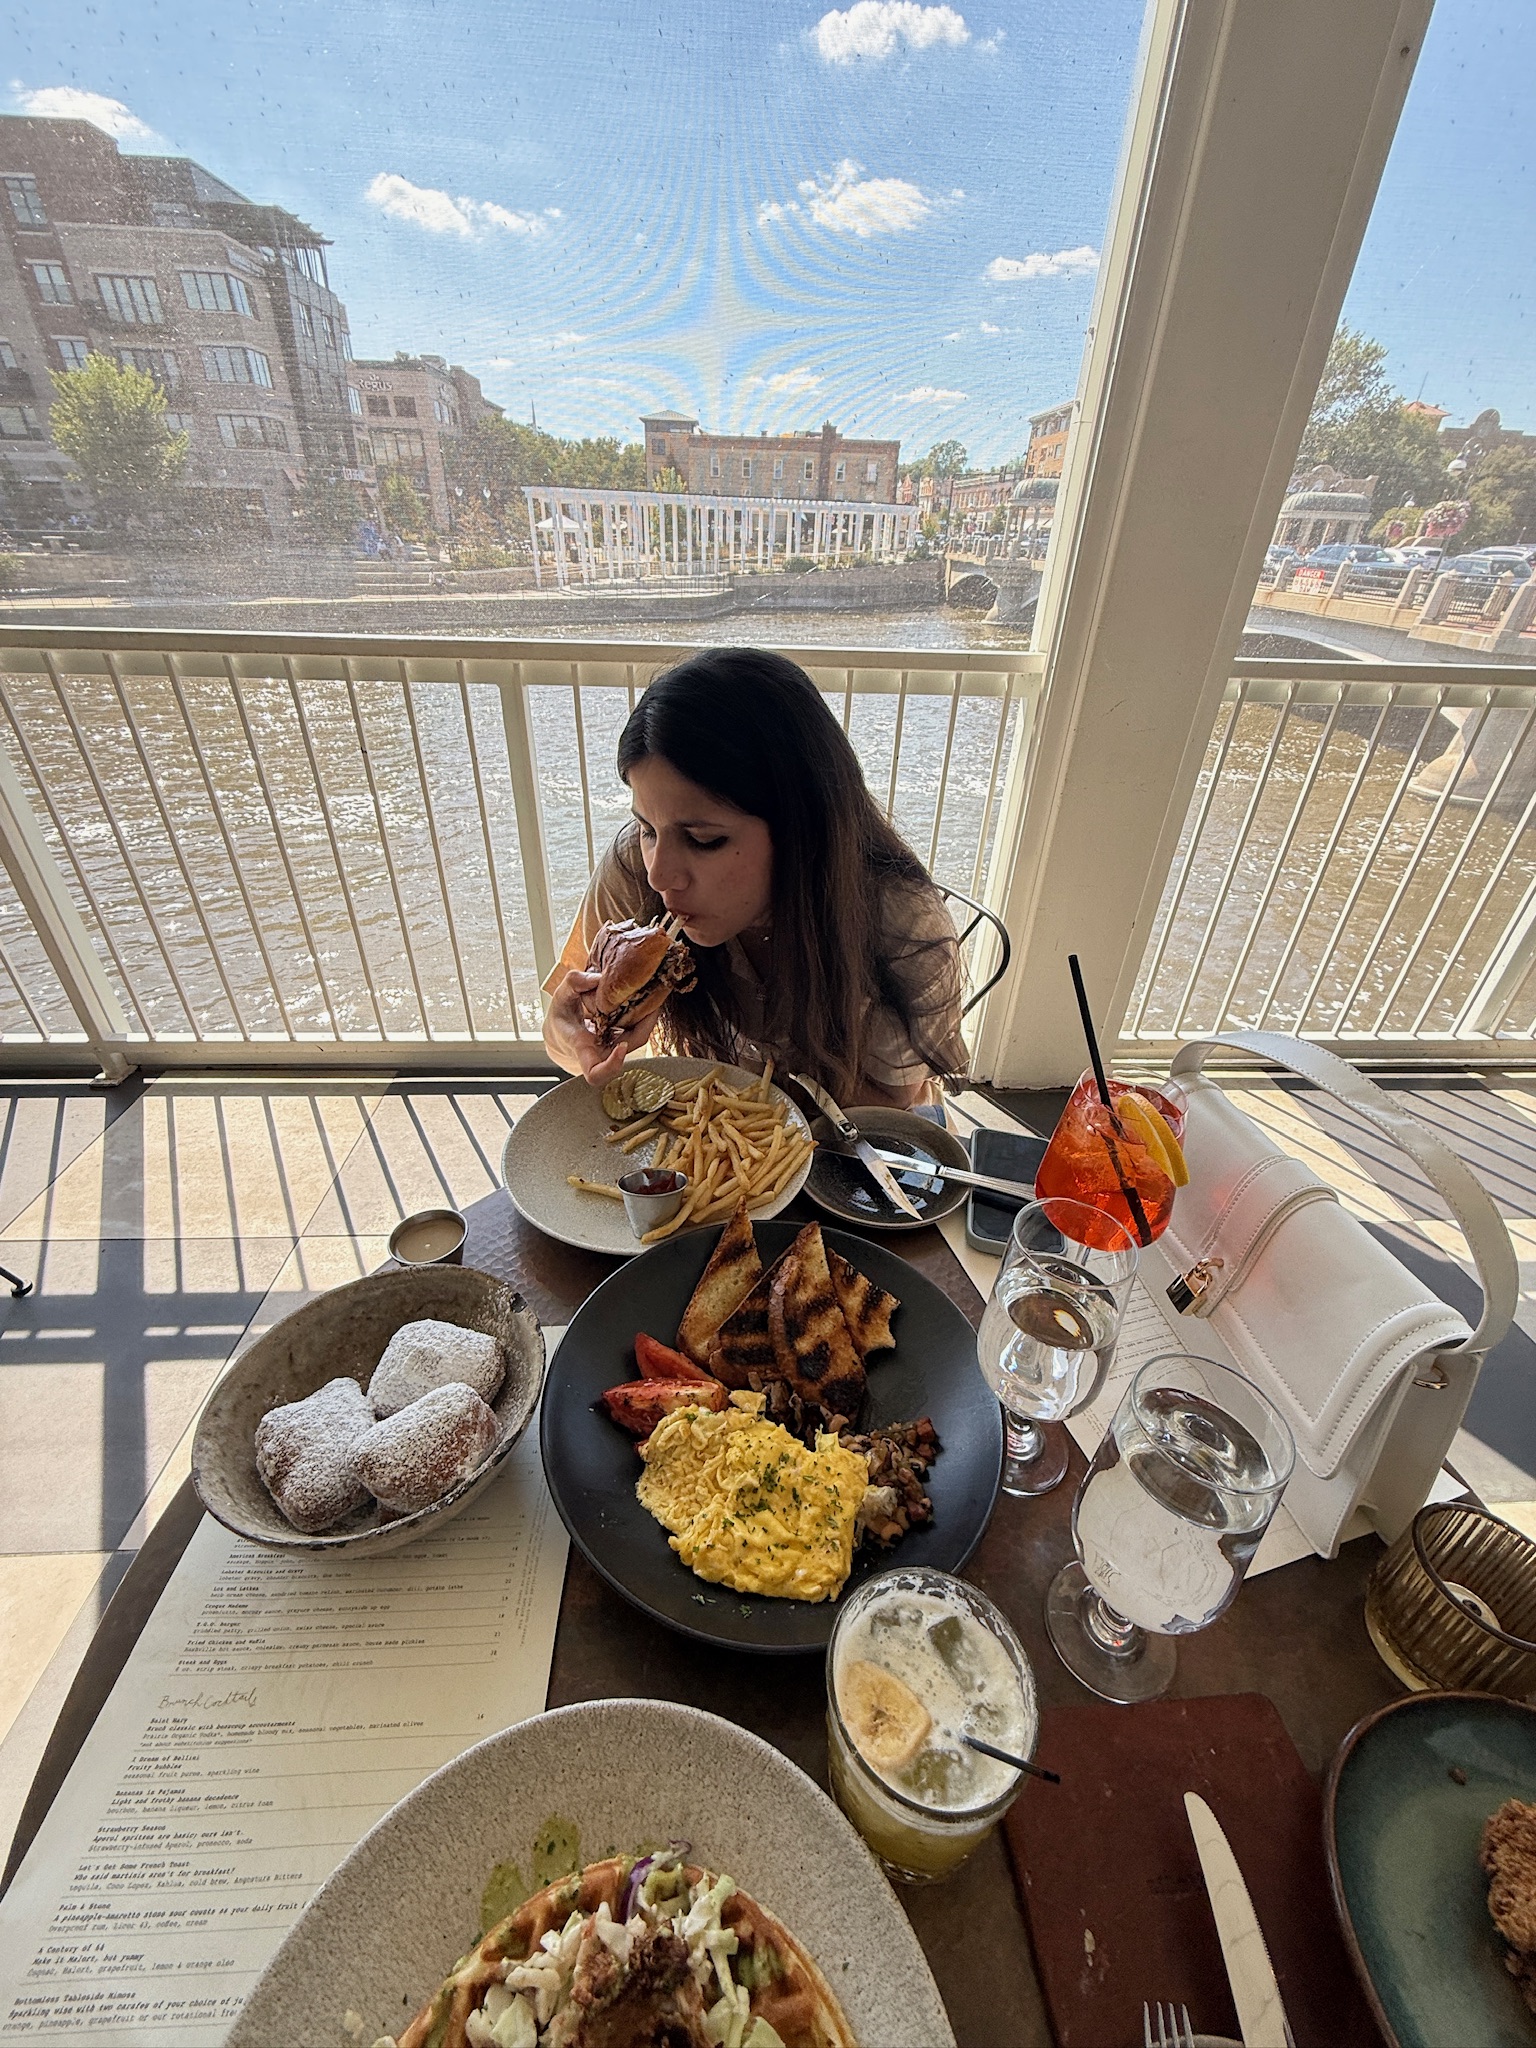
Life isn't all data and dashboards. Outside of work, I'm a fashion lover, food explorer, and photographer. I believe the same curiosity and attention to detail that makes me a great analyst also makes me really good at finding the perfect outfit, the best local spot, and the right filter for golden-hour shots.


Contact Me
Have an opportunity, a question, or just want to say hi? Fill out the form below and I'll get back to you!